
Introduction
In the dynamic field of software development, achieving code quality and maintainability is an ongoing challenge that resonates with development teams and engineers alike. Navigating complex codebases often involves addressing issues such as technical debt, increasing complexity, and the pursuit of maintainable software.
This blog post aims to explore solutions to these challenges, introducing NDepend as a valuable tool tailored for .NET applications. NDepend serves not just as a tool but as a practical compass, guiding developers through code intricacies, facilitating nuanced understanding, and enabling informed decision-making to enhance both code quality and the overall development process.
For software engineers, architects, and R&D managers involved in the intricate dance of software development, NDepend stands out as a tool that brings clarity to complexities. This post invites readers to join in discovering how NDepend transforms the way we perceive, analyze, and improve the codebases we work on. Beyond being just a tool, NDepend has become an essential ally in our collective effort to build software that endures the test of time.
Meet NDepend
NDepend stands out as a robust software analysis tool specifically crafted for .NET applications. Going beyond traditional static code analysis, it provides developers with valuable insights into their codebases.
Key features of NDepend encompass advanced code metrics such as cyclomatic complexity, coupling, and cohesion. These metrics offer a pragmatic assessment of code quality, directing developers towards areas that require improvement and highlighting strengths within the code.
NDepend excels in dependency analysis, offering visual representations of relationships between components and namespaces. More than just diagnostic information, this feature aids developers in making well-informed decisions about their application’s structure.
In addition to the aforementioned capabilities, NDepend is a feature-rich, all-inclusive solution that elevates code quality standards. With features for addressing code smells, debt analysis and management, various quality gates, trend monitoring, and more, it becomes a comprehensive tool for enhancing code quality.
In the upcoming sections, we will delve into how these features position NDepend as a valuable asset for developers, providing practical solutions for improving code quality and maintainability.
Getting Started and the Dashboard
Upon installing NDepend, you’ll find it available both as a standalone tool and as an integrated solution within Visual Studio. The initial setup is straightforward: users are prompted to select the solution they want to analyze. While NDepend supports analyzing multiple solutions within a single project, we’ll focus on dissecting one solution for simplicity.
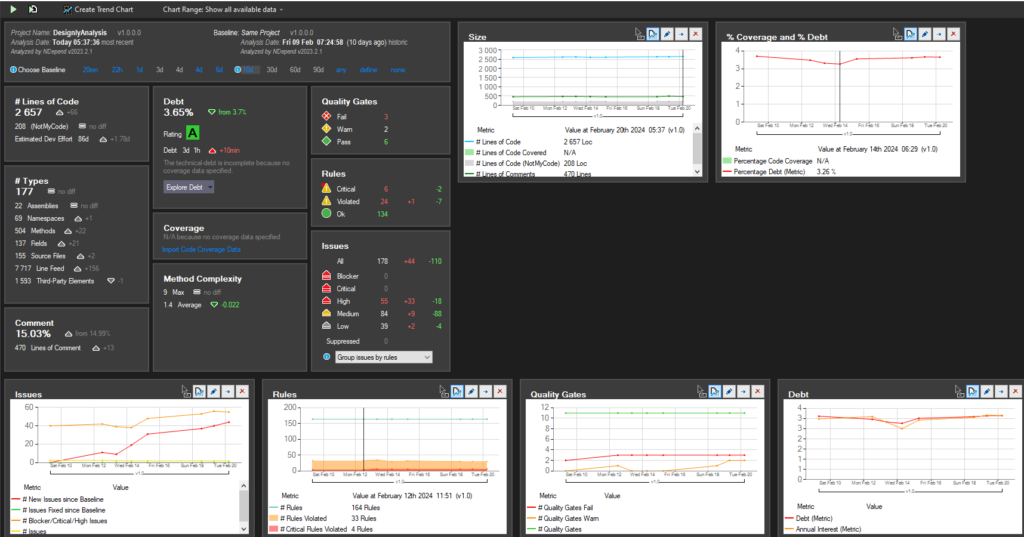
Once you’ve made your selection, NDepend gets to work. It meticulously analyzes your project and presents you with a comprehensive dashboard. Let’s take a closer look at what this dashboard offers:
- Dependency Graph: Visualize the intricate relationships between different components of your code. Spot bottlenecks, circular dependencies, and potential areas for improvement.
- Dependency Matrix: Dive deeper into the dependencies. Understand which parts of your code rely on others and vice versa. This matrix is your compass for untangling complex interdependencies.
- Metrics Galore: NDepend provides a treasure trove of metrics. From cyclomatic complexity to code coverage, you’ll find everything neatly organized. These metrics empower you to make informed decisions about refactoring and optimization.
- Technical Debt Analysis: Uncover hidden technical debt lurking in your codebase. NDepend calculates debt based on code quality violations, and it’s like having a financial advisor for your code!
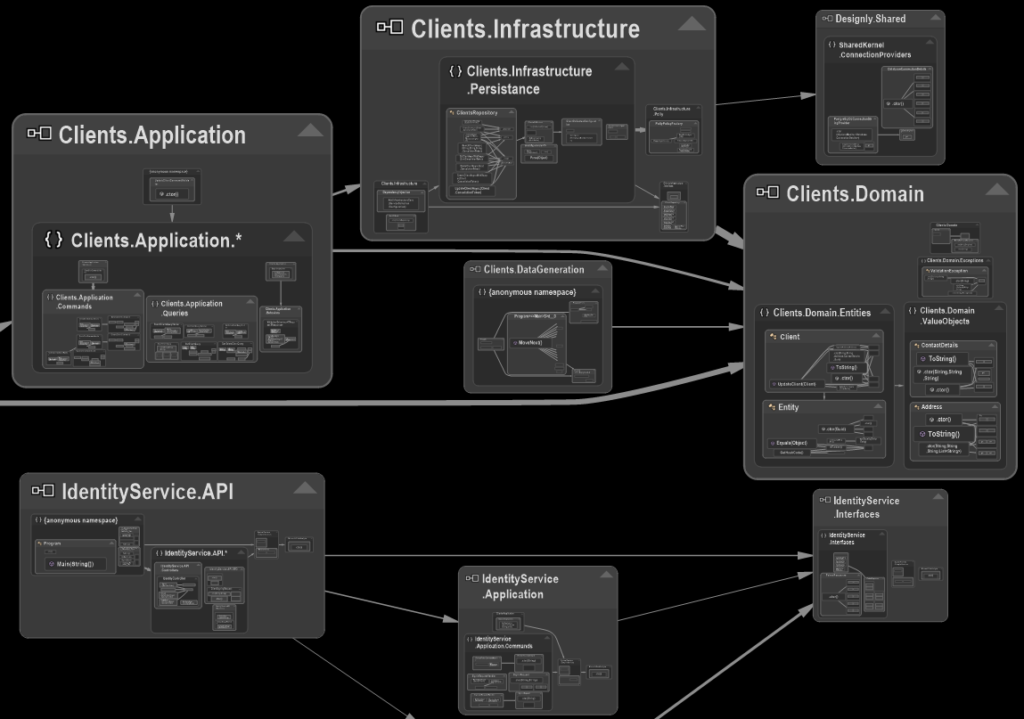
Just beside the dashboard, an excellent addition is the dependency graph in NDepend. This graph visually represents the relationships and dependencies between various components in your codebase. It serves as a powerful tool to understand how different parts of your application are interconnected, helping developers gain insights into the structure and dependencies within the code.
Code Metrics
Understanding code metrics is your gateway to evaluating and enhancing code quality and maintainability. It equips you, the developer, to pinpoint areas for improvement and make well-informed decisions regarding refactoring or optimization. NDepend, specifically designed for .NET applications, provides you with a comprehensive suite of code metrics, covering essential aspects such as cyclomatic complexity, coupling, cohesion, code coverage, and technical debt.
- Cyclomatic complexity, a pivotal metric, delves into the intricacy of a method by counting the number of independent paths through its code. NDepend supports you with visualizations and thresholds, facilitating the identification and resolution of areas with heightened complexity.
- Coupling, another significant metric, gauges the interdependence between modules or components within your codebase. NDepend’s metrics for both incoming and outgoing coupling empower you to precisely pinpoint dependencies and execute targeted refactoring.
- Cohesion, assessing the interrelatedness of elements within a module or component, is seamlessly facilitated by NDepend across various levels, from individual methods to entire namespaces or assemblies.
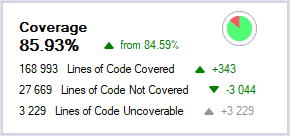
- Code coverage, quantifying the percentage of your code base covered by tests, effortlessly integrates into NDepend’s analysis, providing you with insights into the effectiveness of your test suite. The global coverage percentage is conveniently displayed in the NDepend dashboard, allowing you to compare coverage results against baseline metrics.
NDepend has more than 100+ code metrics with great documentation on each available online in here CQLinq Features (ndepend.com).
Dependency Analysis & Call Hierarchy Diagram
In the world of software development, understanding how different components within a codebase interact is sometimes like deciphering a complex puzzle. This is where NDepend’s dependency analysis feature steps in, shedding light on the hidden connections and dependencies that shape your .NET projects.
Dependency Analysis: The Backbone of Code Understanding
1. Identifying Coupling and Dependencies
Dependency analysis acts as a magnifying glass, revealing the intricate web of relationships between classes, namespaces, and assemblies, especially when the code base of the project becomes large, and complex with many direct and indirect dependencies. Here’s why it matters:
- Dependencies Unveiled: By examining these dependencies, developers gain insights into how changes in one part of the code ripple through the entire system. Imagine it as a ripple effect: tweak one class, and watch the waves propagate.
- Minimizing Surprises: During development or refactoring, unexpected consequences can lurk around the corner. Dependency analysis helps you anticipate these surprises by highlighting potential impacts.
2. Architectural Clarity Through Visualization
Picture a grand architectural blueprint. Now imagine that blueprint representing your codebase. Dependency analysis provides a bird’s-eye view of this blueprint:
- Dependency Graphs: Visualize the connections between components. See which parts rely heavily on others and which stand independently. It’s like having a GPS for your code.
- Code Organization Insights: Now that you have this understanding, you can make informed decisions about code structure. Should you refactor? Where should you introduce boundaries? The answers might lie in the dependency graph, shown in an easy-to-navigate way.
Call Hierarchy Diagram: Navigating the Code Maze
The call hierarchy diagram complements dependency analysis. It’s like having a treasure map that guides you through the labyrinth of method calls:
- Method Call Chains: Trace the flow of execution. Which methods call which other methods? The call hierarchy diagram lays it out, helping you follow the code’s footsteps.
- Spot Bottlenecks: Identify performance bottlenecks. Are certain methods calling each other excessively? Optimize where needed.
Real-world Scenarios: Where Dependency Analysis Shines
- Uncovering Hidden Dependencies:
- Imagine a seemingly independent module. Dependency analysis might reveal that it’s tightly coupled with another module. Addressing this dependency can prevent future headaches.
- Detecting Circular Dependencies:
- Circular dependencies—when A depends on B, and B depends on A—are code’s nemesis. Dependency analysis spots them, allowing you to break the cycle and improve maintainability.
- Streamlining Build Processes:
- Unnecessary dependencies slow down your build process. Dependency analysis helps you trim the fat, reducing build times and boosting efficiency.
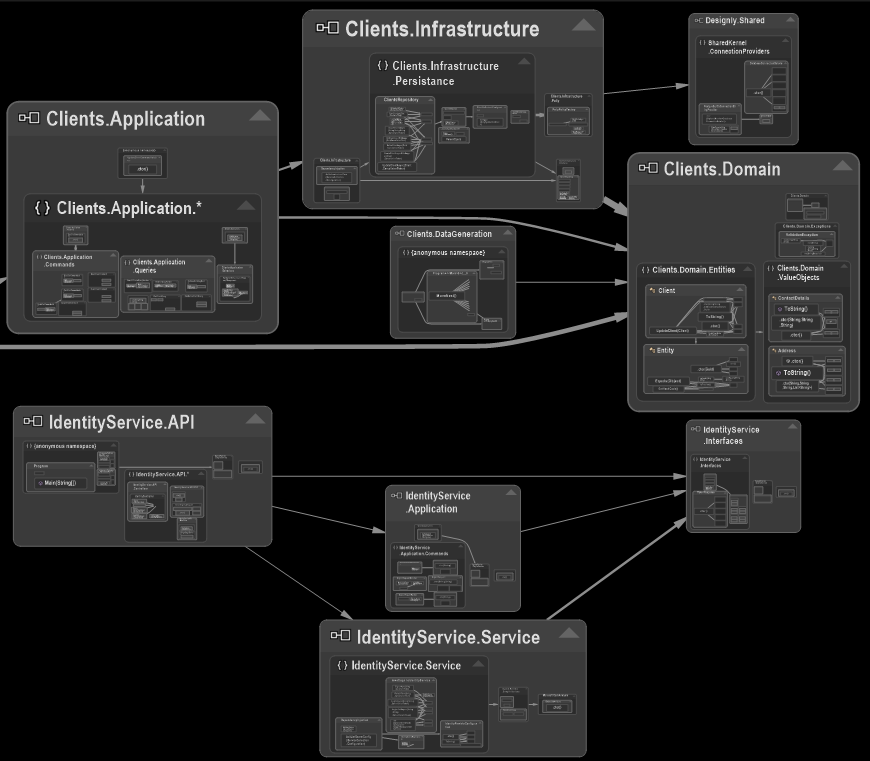
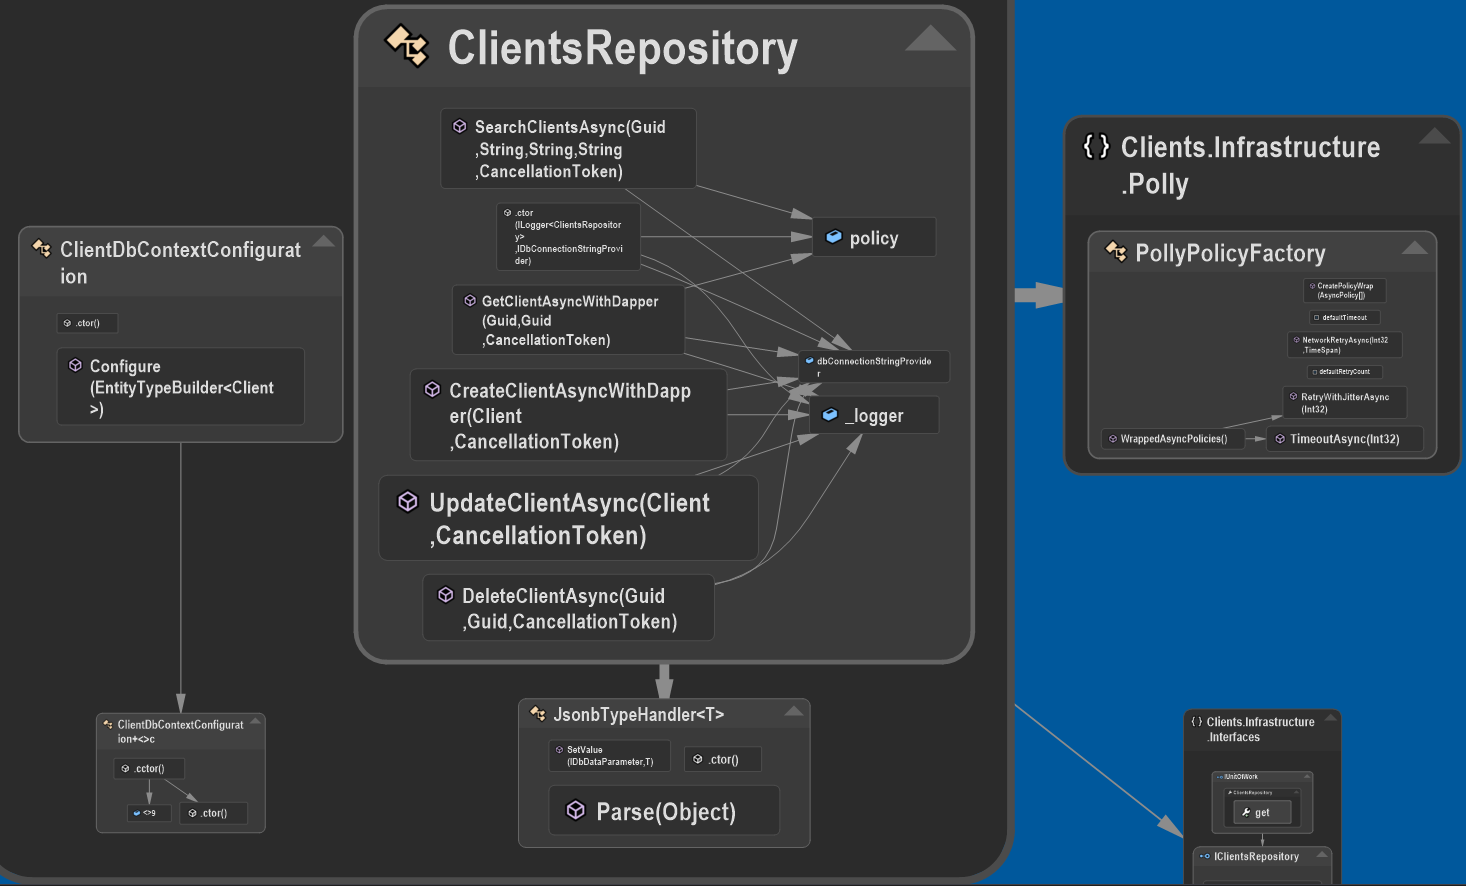
The Dependency Graph boasts a range of impressive features that enhance visibility into the intricacies of the code base, offering insights from a panoramic 10,000-foot overview down to the granularity of individual methods! This interactive graph elevates user experience, allowing a simple click on any element to reveal vibrant colors, showcase call hierarchy, and unveil additional details.
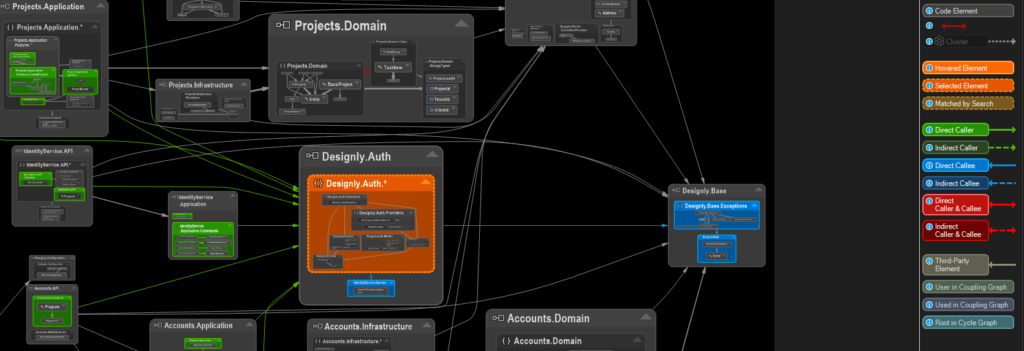

NDepend’s dependency analysis and call hierarchy diagram empower you to navigate the code base with confidence.
Remember: Understanding your code’s dependencies isn’t just a luxury; it’s a necessity. Happy analyzing! 🚀
Code Metrics Heat Map
Understanding code metrics is essential for developers and managers to keep tabs on how well their software is doing. These metrics measure stuff like how big the code is, how complicated it is, how good the quality is, and how well it’s covered by tests. But, making sense of all these numbers can be tricky. That’s where the NDepend Metric View comes in.
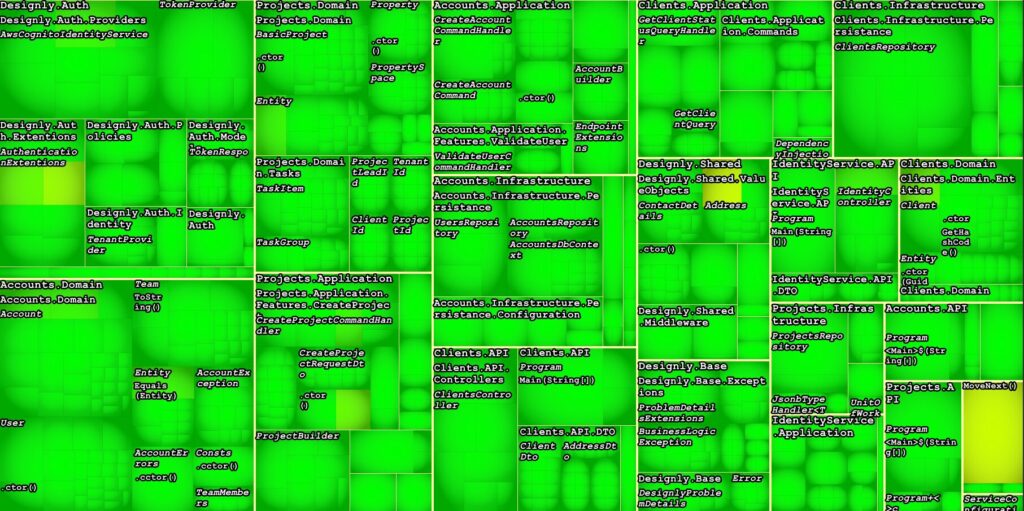
With the NDepend Metric View, you can create cool heat maps of your code metrics. These heat maps use a treemap algorithm, which means they show your code in little rectangles within bigger rectangles. Each rectangle’s size and color tell you something important about your code, like how complex it is or how much it’s covered by tests. It’s like looking at a map that shows you where the most important stuff is in your code, like which parts need the most attention.
You can tweak the heat map to show you exactly what you want to see. Want to know which methods are the most important? Or which parts of your code are the most complex? With the NDepend Metric View, you can customize the colors based on things like method rank, code coverage, cyclomatic complexity, and more. It’s like having a personalized dashboard for your code, helping you make smarter decisions and write better software.
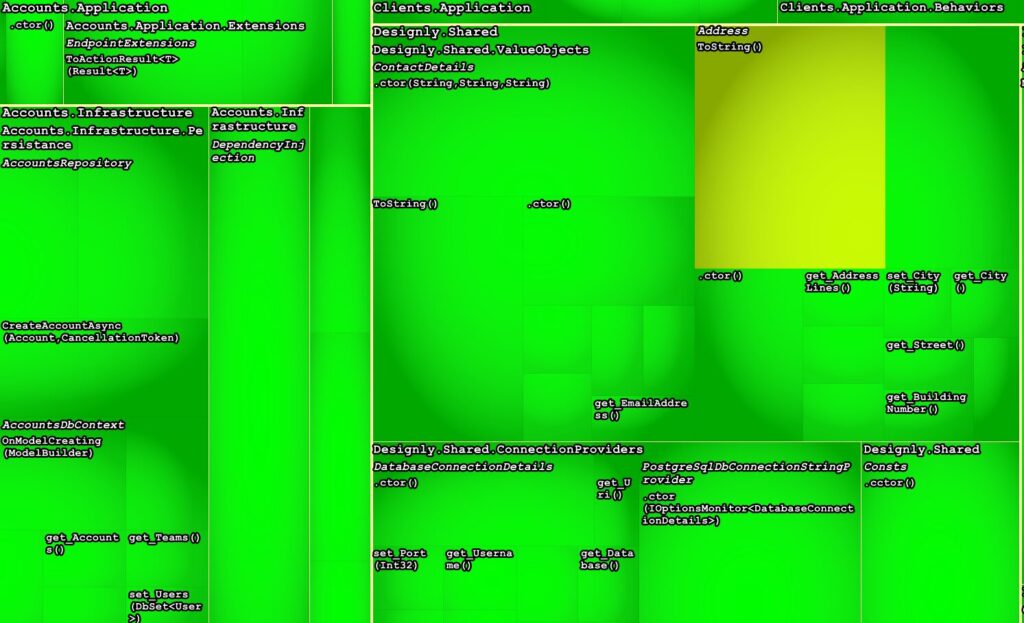
Zooming in we can get even a closer look at the method level:
Dependency Matrix
Understanding your code’s structure is crucial, and a Dependency Structure Matrix (DSM) serves as a compact guide to unravel dependencies between components in your code base. It’s like a map that helps you spot patterns like layered structures, cycles, cohesion, coupling, and popular components. In this blog post, we’ll dive into the basics of DSM and explore how NDepend’s DSM tool can be a game-changer for analyzing your code dependencies.
DSM is a square matrix where each row and column represents a code element, like a namespace, type, or method. A cell with content signals a dependency between the corresponding code elements of that row and column. The color and number of the cells provide insight into the direction and strength of the dependency. Blue might mean the row element is using the column element in three ways, while green could indicate the opposite. NDepend’s DSM tool offers an array of features to empower you in dissecting your code dependencies effectively.
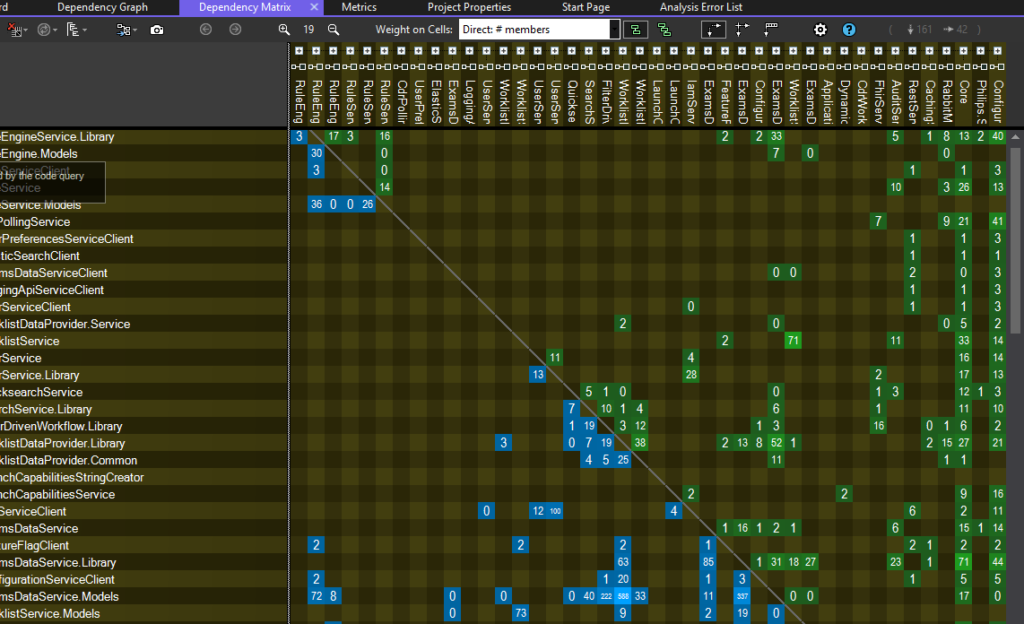
With NDepend’s DSM tool, you can filter, sort, group, expand, and collapse the matrix, zooming in on the parts of your code that matter most. You can toggle between direct and indirect dependency modes, the latter indicating a chain of dependencies between two elements. Dive deeper by opening a dependency graph or a code query from any cell to gain more details about the dependency. Clicking on a dependency “rectangle” takes us to the graph representation of it:
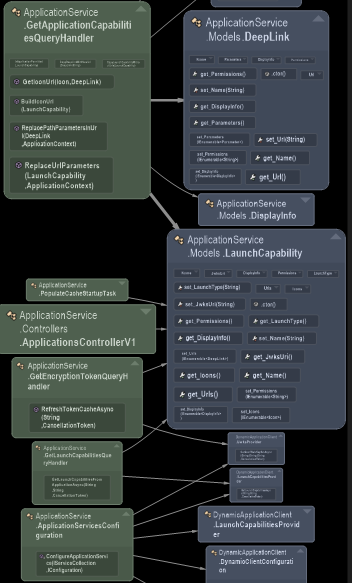
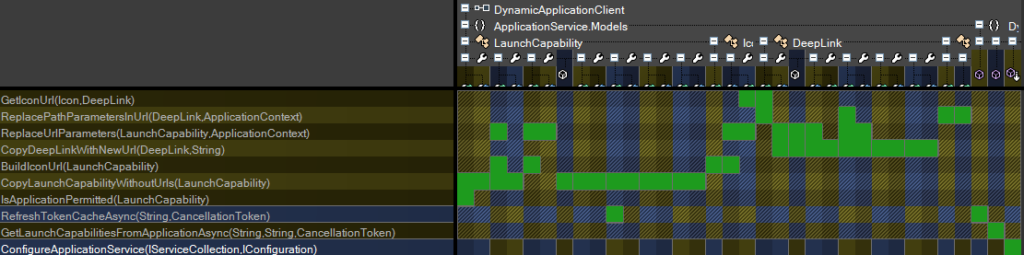
Or, we can open the dependency and “zoom” it for a more granular view:
Technical Debt Estimation
Technical debt is a metaphor that describes the long-term costs and consequences of taking shortcuts or making suboptimal decisions in software development. Technical debt can affect the quality, performance, maintainability, and security of the code base, as well as the productivity and satisfaction of the developers.
One of the challenges of managing technical debt is how to measure it and prioritize its repayment. NDepend offers a smart and customizable solution for technical debt estimation and management.
NDepend allows you to define your own code rules and quality gates using the CQLinq language, which is a powerful and expressive query language based on LINQ. For each code rule, you can specify a formula to estimate the technical debt and the annual interest of each issue that violates the rule. The technical debt is the estimated effort that would take to fix the issue, and the annual interest is the estimated cost per year if the issue is left unfixed. Both the technical debt and the annual interest are measured in man-time, such as minutes, hours, or days.
NDepend also provides a set of default code rules and quality gates, based on the SQALE method, that cover various aspects of code quality, such as complexity, coupling, cohesion, naming, readability, testability, and more. You can use these rules as they are, or modify them according to your needs and preferences.
Using NDepend, you can get a comprehensive and accurate overview of the technical debt of your code base, as well as the breakdown by code elements, rules, and quality gates. You can also see the trend and evolution of the technical debt over time, or across different versions or branches of your code base. You can also compare the technical debt with other code metrics, such as lines of code, cyclomatic complexity, or test coverage, using various diagrams and heat maps.
Code Rules & LINQ Queries
Code Rules and Queries within NDepend offer you, the developer, a robust mechanism—a powerful tool to maintain and elevate coding standards, conduct specific analyses, and uphold a consistent codebase. Leveraging LINQ, you can craft your custom queries, essentially allowing you to analyze almost anything you need within your codebase. Let’s explore a few examples:
Example: Finding which project in the solution depends on certain assembly:
from a in Assemblies
where a.IsUsingAssembly("Clients.Domain")
select a
Example of Custom Rule: Avoiding High Cyclomatic Complexity:
LINQ enables the creation of a custom rule identifying methods with high cyclomatic complexity, thereby enforcing a standard to keep methods concise and maintainable.
from m in Methods
where m.CyclomaticComplexity > 10
select new { m, m.CyclomaticComplexity }
Finding all 3rd-party in the solution:
Let’s assume we need to see what all the 3rd party assemblies that we use in our solution, not including the ones from Microsoft (to filter out the standard libraries). To do this, we can write the following LINQ:
from a in Assemblies
where (a.IsThirdParty && !a.CompanyName.Contains("Microsoft") )
select a
Ensuring Consistent Naming Conventions:
LINQ queries facilitate the enforcement of consistent naming conventions by identifying methods or classes deviating from established standards. For example, let’s assume we need to check if all the async method names in the source coding with “Async”:
from m in Methods
where !m.Name.EndsWith("Async") && m.IsAsync
select m
These are only just simple and basic examples of what can we achieve with this great feature – If you’d like to learn more, feel free to explore the product online documentation here: CQLinq Features (ndepend.com)
Analysis Report
One of the most useful features of NDepend is its ability to generate a comprehensive and interactive HTML report from the analysis results. The HTML report is a static web page that can be opened in any browser, without requiring NDepend to be installed. It is a great way to share code quality insights with other stakeholders, such as developers, managers, or clients.
The HTML report contains several sections that provide different perspectives on the code base, such as:
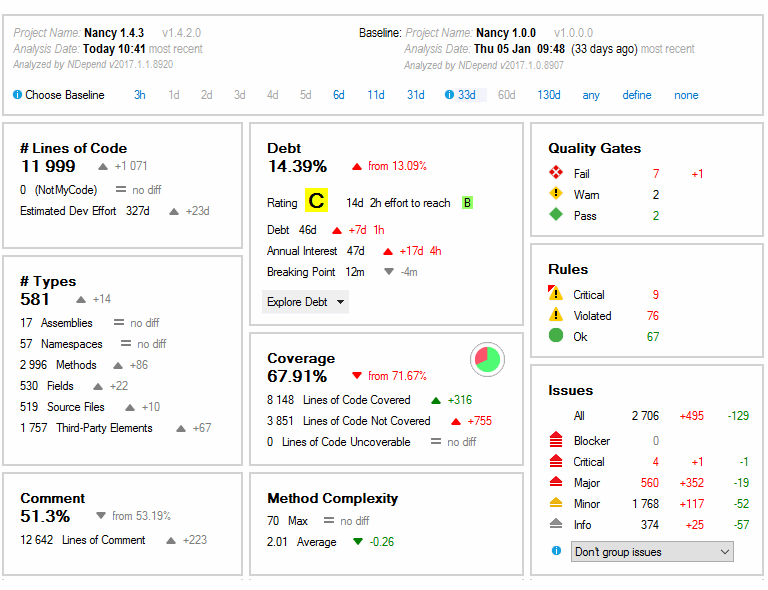
- Overview: This section provides a summary of the analysis, such as the date, duration, version, quality gates, and rules. It also shows the comparison with a baseline analysis obtained from a previous run or a different branch.
- Diagrams: This section displays four types of diagrams that visualize the code structure and metrics, such as dependency graph, dependency matrix, treemap, and abstractness vs. instability. The diagrams can be viewed in different modes and scales and can be zoomed, panned, filtered, and exported.
- Application Metrics: This section shows various metrics related to code quality, such as lines of code, estimated development effort, technical debt, coverage, method complexity, and issues. It also shows the changes from the baseline analysis and the ratings for each metric.
You can access and navigate the report details from a dedicated tab per topic on the main page:
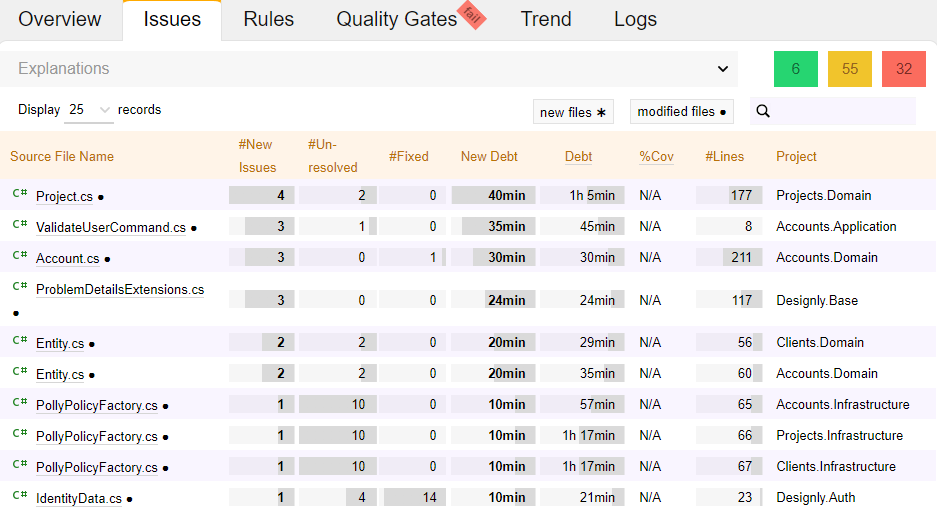
- Issues: This tab shows the list of code issues detected by NDepend’s rules. You can filter, sort, group, and export the issues by various criteria, such as severity, category, debt, status, and location. You can also see the source code and the rule description for each issue.
- Rules: This tab shows the list of code rules defined by NDepend. You can see the status, description, and query of each rule, as well as the number of issues and debt it generates. You can also edit, disable, or create new rules using the CQLinq language.
- Quality Gates: This tab shows the list of quality gates defined by NDepend. You can see the status, description, and query of each quality gate, as well as the value and trend of the metric it evaluates. You can also edit, disable, or create new quality gates using the CQLinq language.
- Trends: This tab shows the evolution of various code metrics over time, such as lines of code, technical debt, coverage, issues, and quality gates. You can see the trend charts, the baseline comparison, and the trend metrics for each code element. You can also customize the trend settings and criteria.
The HTML report is not only informative but also interactive. You can click on any element in the report to see more details, such as the source code, the dependencies, the code rules, and the code queries. You can also customize the report by changing the settings, such as the color scheme, the heat map criteria, the quality gate thresholds, and the code rules.
If you would like to explore some rich sample reports, you can take a look here: Sample Reports with Ndepend
NDepends vs Others – Competing products
Before we start, let me clarify that this is not a review and comparison between SonarQube and NDepend. I am not trying to endorse or criticize any of these tools. I am just sharing some of the features that make NDepend different from SonarQube, based on my knowledge and experience. I hope you find this information helpful and interesting.
One of the main differences between NDepend and SonarQube is the scope and depth of the analysis. NDepend covers not only the implementation level issues but also the design and architecture level issues. It can detect various code smells, such as long methods, large classes, feature envy, god classes, and more. It can also identify code structure patterns, such as layered structure, cycles, cohesion, coupling, and popular components. NDepend can also analyze the dependencies between the code elements, and visualize them using various diagrams, such as dependency graph, dependency matrix, treemap, and abstractness vs. instability.
Another difference between NDepend and SonarQube is the customization and extensibility of the analysis. NDepend allows the user to define their own code rules and quality gates using the CQLinq language, which is a powerful and expressive query language based on LINQ. The user can also customize the color scheme, the heat map criteria, the quality gate thresholds, and the code metrics. NDepend also supports integration with other tools, such as Visual Studio, Azure DevOps, TeamCity, Jenkins, and more.
A third difference between NDepend and SonarQube is the reporting and communication of the analysis results. NDepend can generate a comprehensive and interactive HTML report that can be opened in any browser, without requiring NDepend to be installed. The HTML report contains various sections that provide different perspectives on the code base, such as overview, diagrams, application metrics, issues, rules, quality gates, and trends. The HTML report is also interactive, as the user can click on any element to see more details, such as the source code, the dependencies, the code rules, and the code queries. It can even compare the current analysis with a previous one to track progress and trends over time or across teams.
Additionally, NDepend is serverless, eliminating the need to install and maintain a complex server for report generation. Simply starting NDepend.Console.exe on your NDepend project (.ndproj file) is sufficient to obtain a report in a few seconds. The analysis states that will be re-used, such as baseline or trend metric history, are saved in files in the NDepend project’s output directory. Data in this directory is re-used when running NDepend.Console.exe again and can be easily transferred to another machine through a simple copy/paste.
Conclusion
Disclaimer: I do not work for NDepend, nor am I affiliated with them in any way. I have tried to make this post as objective and unbiased as possible, based on my knowledge and experience. This is not a marketing post, and it does not have any marketing purpose. I am just sharing my personal opinion and review of NDepend as a user.
In this post, we have reviewed NDepend, a static code analysis tool for .NET and .NET Core projects. We have seen how NDepend can help us measure, understand, and improve the quality of our code at different levels of granularity. We have also highlighted some of the features that make NDepend different from other tools like SonarQube, such as the scope and depth of the analysis, the customization and extensibility of the analysis, and the reporting and communication of the analysis results.
NDepend is a powerful and versatile tool that can help us write better code, faster and easier. It can also help us communicate the state and evolution of our code base clearly and engagingly. Whether you are a developer, a manager, or a client, NDepend can provide you with valuable insights and suggestions for your code quality.
Cover Photo by Ksenia Chernaya